

Icarus の使い方最初の一歩
Recently I had a chance to write an article about using the Runber FPGA board, the development tool GOWIN EDA does not come with Verilog Simulator. So I searched free Verilog Simulators and found “iverilog”, but it requires Linux or Cygwin kind of environment, so I was afraid that it is not for usual Windows users. But a friend of mine taught me about “Icarus”. This tool can be used within a usual Windows environment, and it seems that this tool can be used for circuits designed in GOWIN EDA. So the following is my setup steps of Icarus.
先ごろ、Runber FPGA ボードを使用した記事を書く機会があったのですが、開発に使用した GOWIN EDA には標準では Verilog Simulator が付属していませんでした。無償で使える Verilog Simulator はないかなと探していたところ iverilog というものがあること知りましたが、環境が Linux や Cygwin なので、普通の Windows ユーザーには少し敷居が高いかなと放置していたところ、知人から Icarus というのがあることを教えていただきました。これなら Windows の環境内でも使用できるので、GOWIN EDA で作成した回路の検証にも使えそうです。ということで、私が Icarus を導入した手順は以下の通りでした。
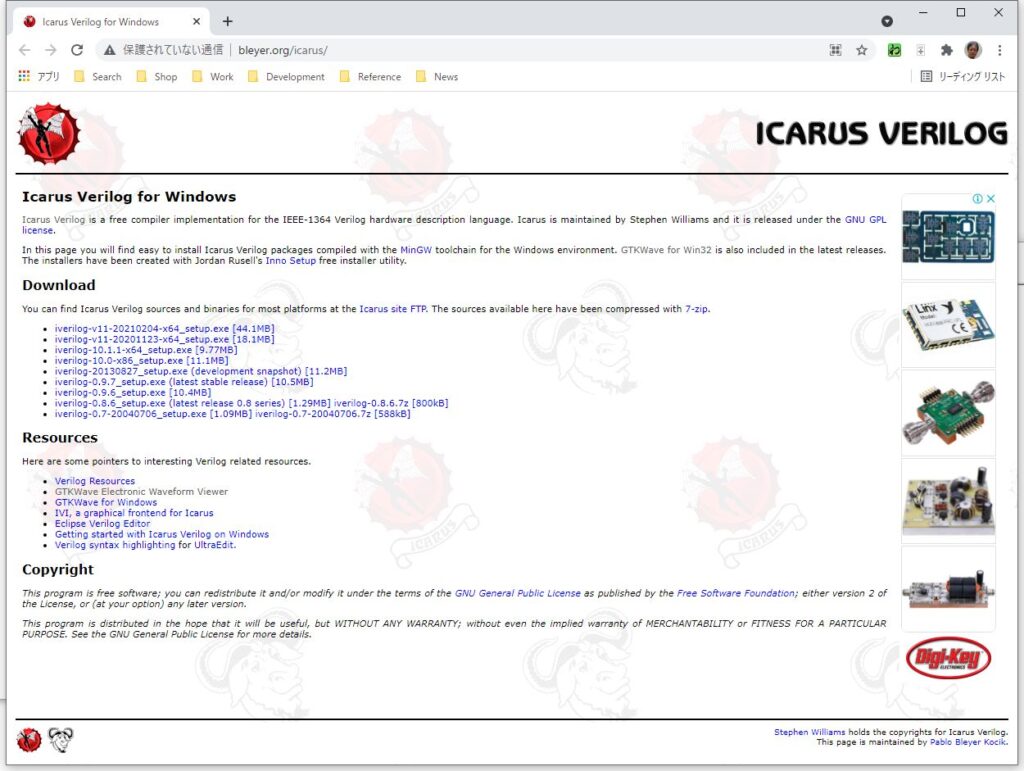
First of all, visit icarus web, and get the setup for iverilog and GTKWave for Windows. At the time (22-Sep-2021), the newest version was iverilog-v11-20210204-x64_setup.exe.
まず icarus の URL より、Windows 用の iverilog と GTKWave のセットアップを入手します。
2021年9月22日時点の最新版は iverilog-v11-20210204-x64_setup.exe でした。
Installation / インストール
Execute the downloaded setup as an administrator.
ダウンロードしたセットアップファイル iverilog-v11-20210204_setup.exe を管理者として実行します。
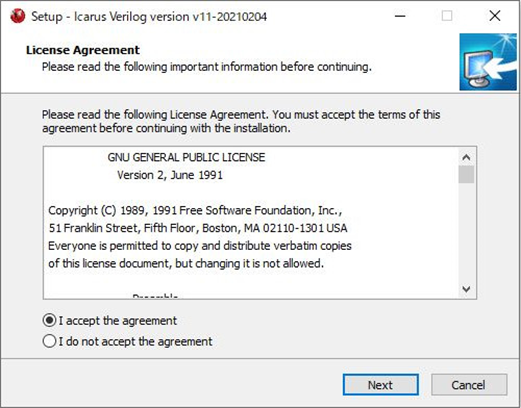
The Setup wizard starts. And License Agreement is displayed.
Read and if you accept the agreement, check “I accept the agreement” and select [Next].
Setup ウィザードが起動します。
最初に GNU のライセンスアグリーメントが表示されます。
同意できる場合には
I accept the agreement
を選択して [ Next ] を選択します。
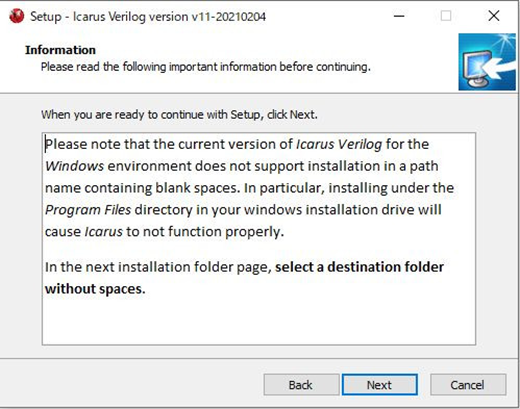
Before starting installation, a warning about path name is shown. The tool does not accept a path name which has space chars, for example “Program Files” is not a good path. After reading the message, select [ Next ].
インストール前に、パス名にはスペースが入っていると正常に動作しないので、例えば “Program Files” フォルダなどにはインストールしないでくださいといった情報が表示されます。
[ Next ] を選択します。
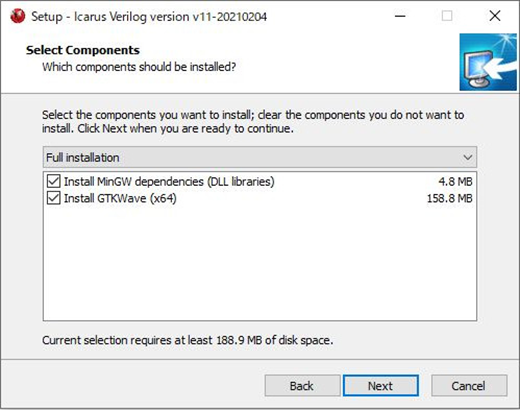
Select which components to install. For my case I checked all (default) and selected [ Next ] .
インストール対象を選択します。私はすべてチェックをして [ Next ] を選択しました。
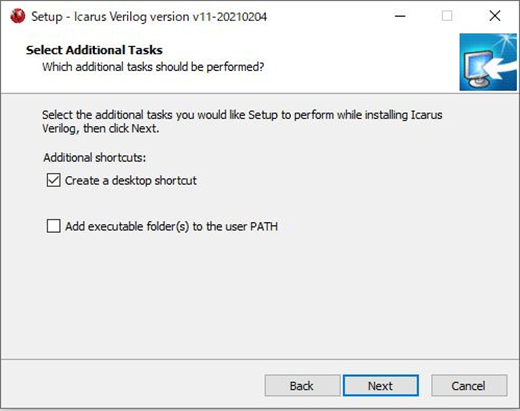
Selecting additional tasks. I selected “Create a desktop shortcut” but I did not select “Add executable folder(s) to the user PATH“, which I regretted later. (I recommend to check this, too). Select [ Next ].
追加タスクの選択、デスクトップにショートカットアイコンを作成するを選択しましたが、PATH に実行形のフォルダを追加するも追加しておくべきだったと後で後悔しました。[ Next ] を選択します。
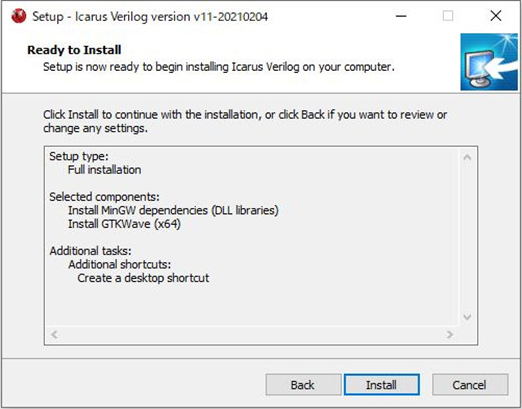
Now installation is ready to go, select [ Install ].
インストール前の準備が完了しました。[ Install ] を選択します。
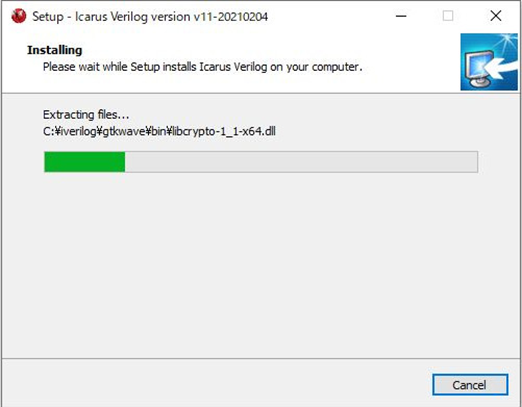
Installing …
・・・インストール中・・・
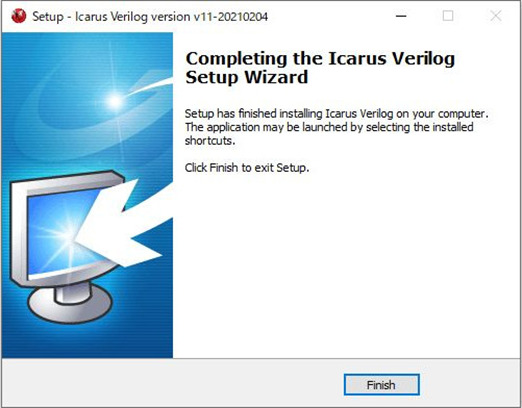
Now setup is complete. Select [ Finishi ].
セットアップが完了しました。[ Finish ] を選択します。
Adding the Environment Variables.
環境変数の設定
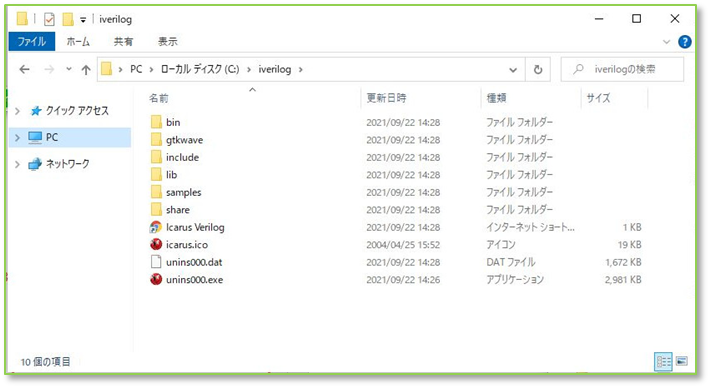
After the installation, a folder “C:\iverilog” has been created and the executables are in
C:\iverilog\bin
and
C:\iverilog\gtkwave\bin
So, add these two pathes in the Windows Environment variable “Path”.
Note: This was not necessary, if I had checked the “Add executable folder(s) …” option above.
インストールが終了すると、C:\iverilog というフォルダが作成され、実行プログラムは
C:\iverilog\bin
と
C:\iverilog\gtkwave\bin
に入っていますので、この二つのパスを、Windows の環境変数 Path に追加します。
※前の設定でこのオプションを指定していれば不要でした。
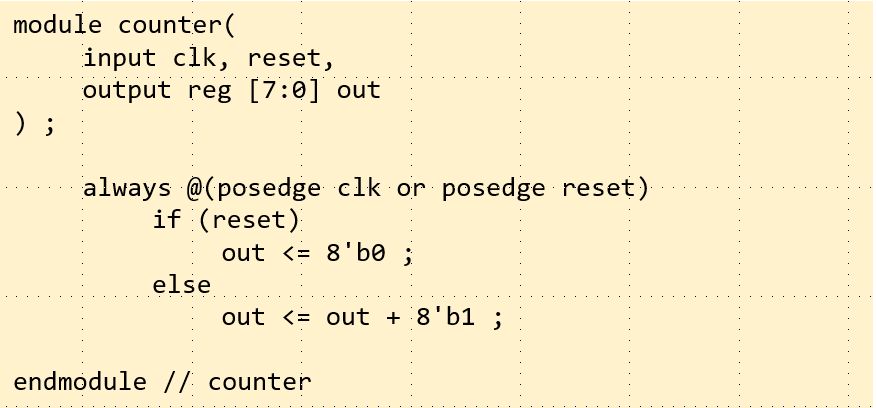
Simple test.
To test the Verilog HDL simulation, prepare a simple test circuit.
簡単な動作テスト
Verilog HDL シミュレーションのテストを行うために簡単なテスト回路を用意します。
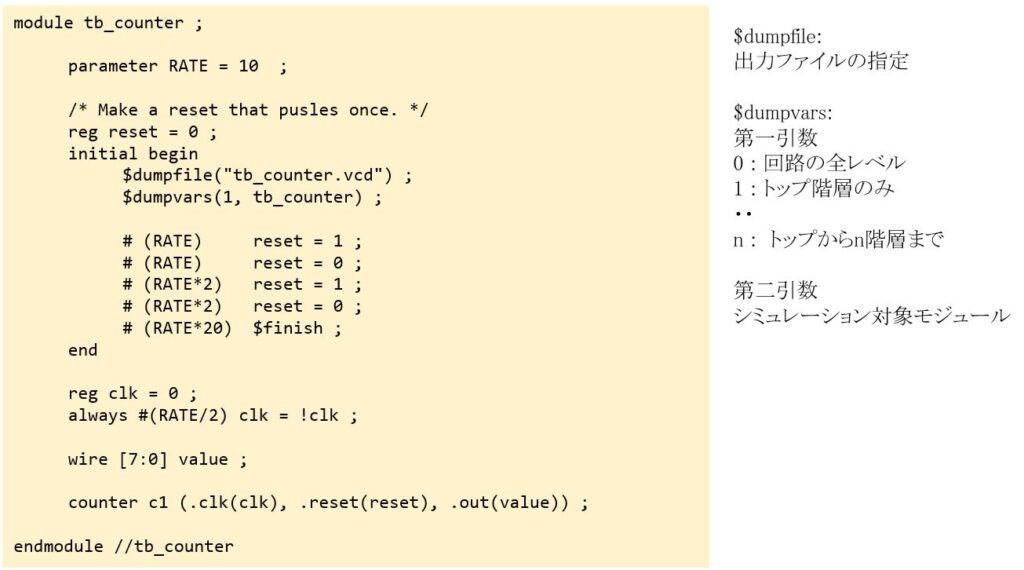
Test Bench circuit.
テストベンチ回路
Simulation and viewing the result
シミュレーションと結果表示
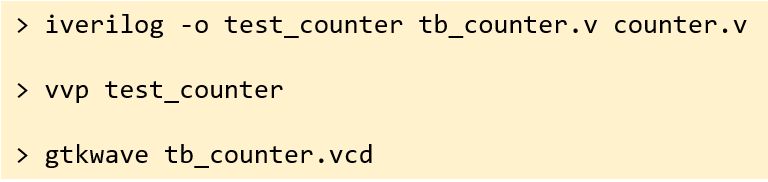
After previous preparations are done, using “Command Prompt”,
change director to the folder where
counter.v
tb_counter.v
resides. Then enter the following commands.
前項までの準備が出来たところ、コマンドプロンプトを使用して、
counter.v,
tb_counter.v
のあるフォルダにて下記のコマンドを実行します。
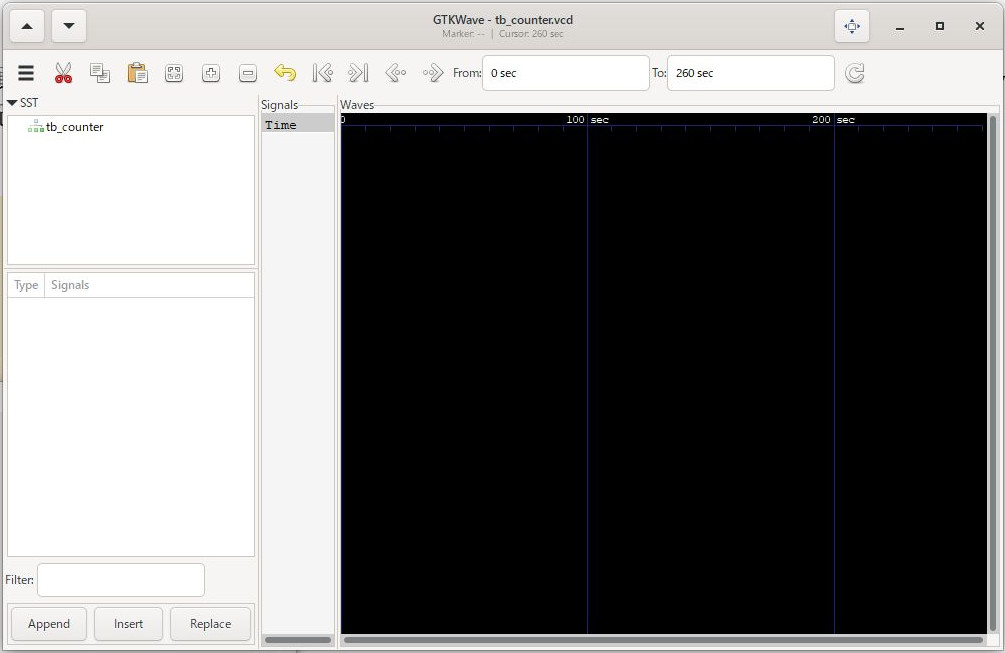
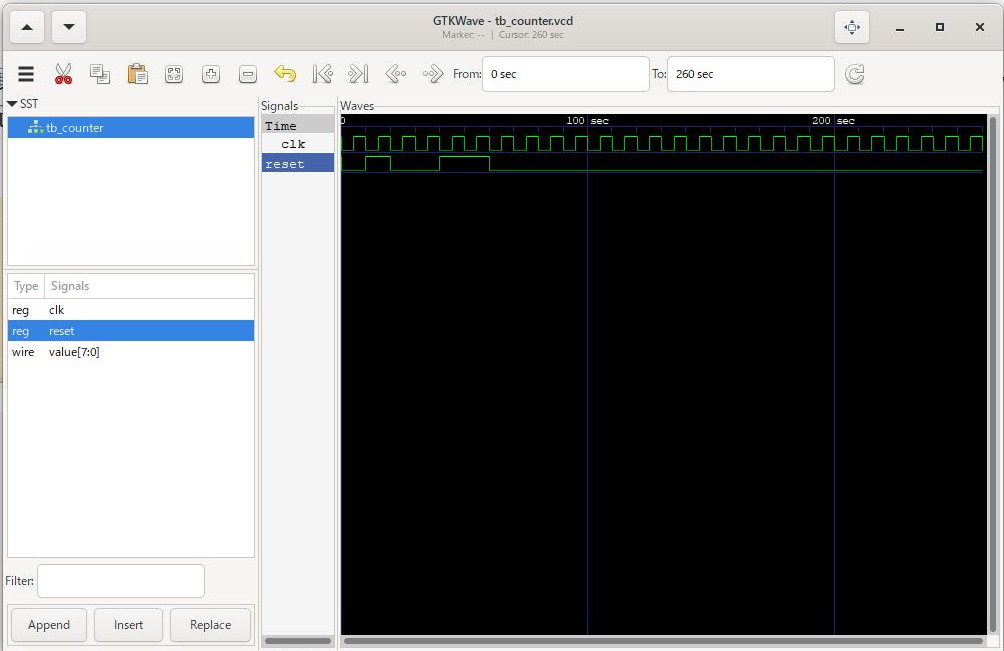
Then GTKWave window appears.
すると gtkwave のウィンドウが表示されます。
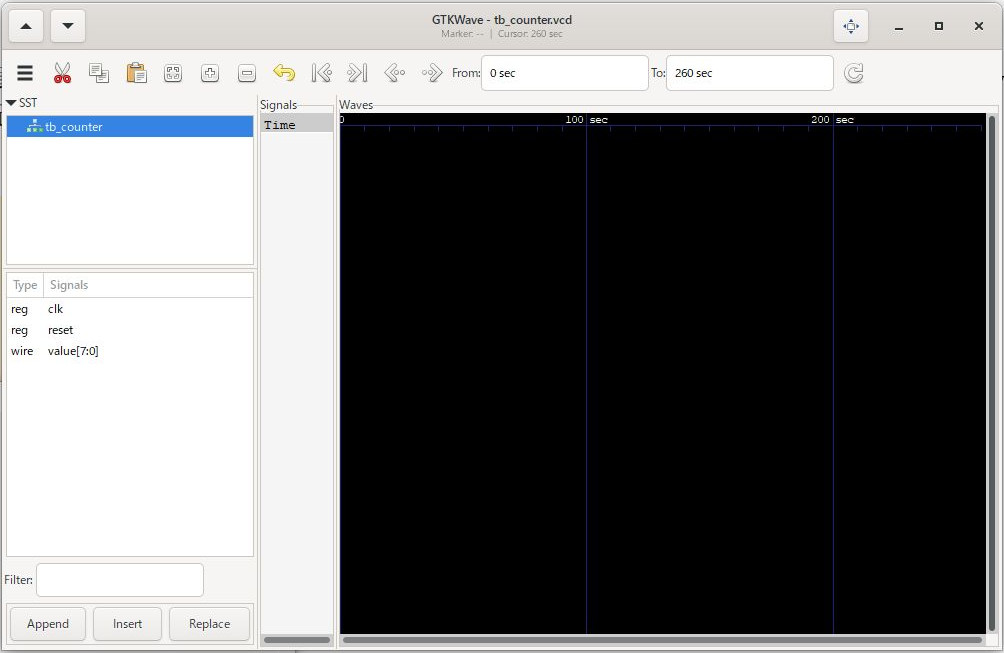
Although this a simple display, by double clicking the string “tb_counter” in the SST pane, we can view the signal names observed in the test.
ひどく素気ない表示ですが、左上の SST ペイン内の tb_counter というアイコンをダブルクリックすると、そのテストで観測された信号名が左下のペインに表示されます。
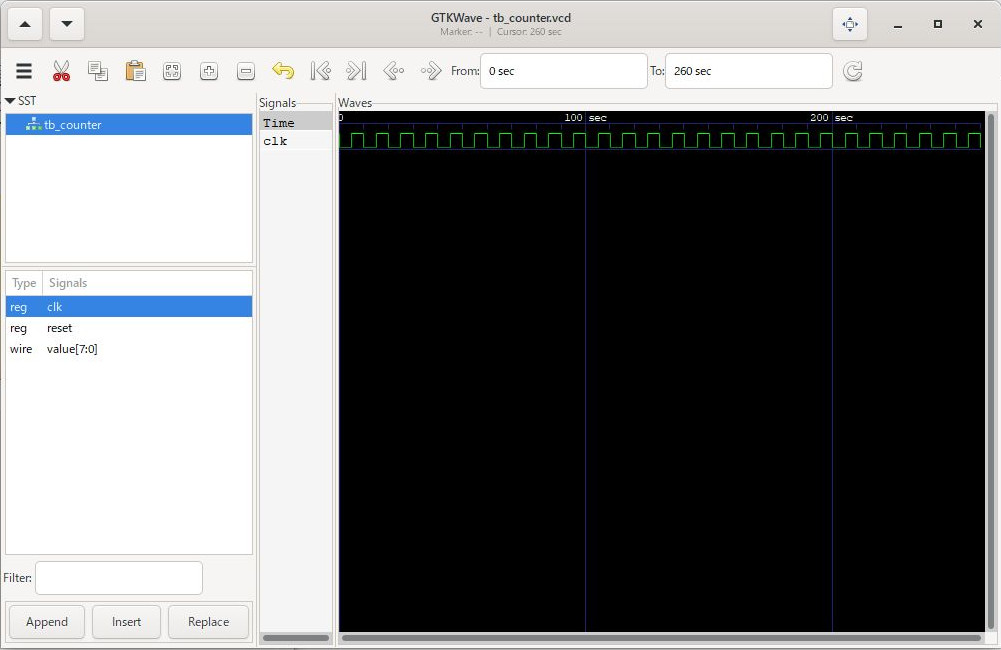
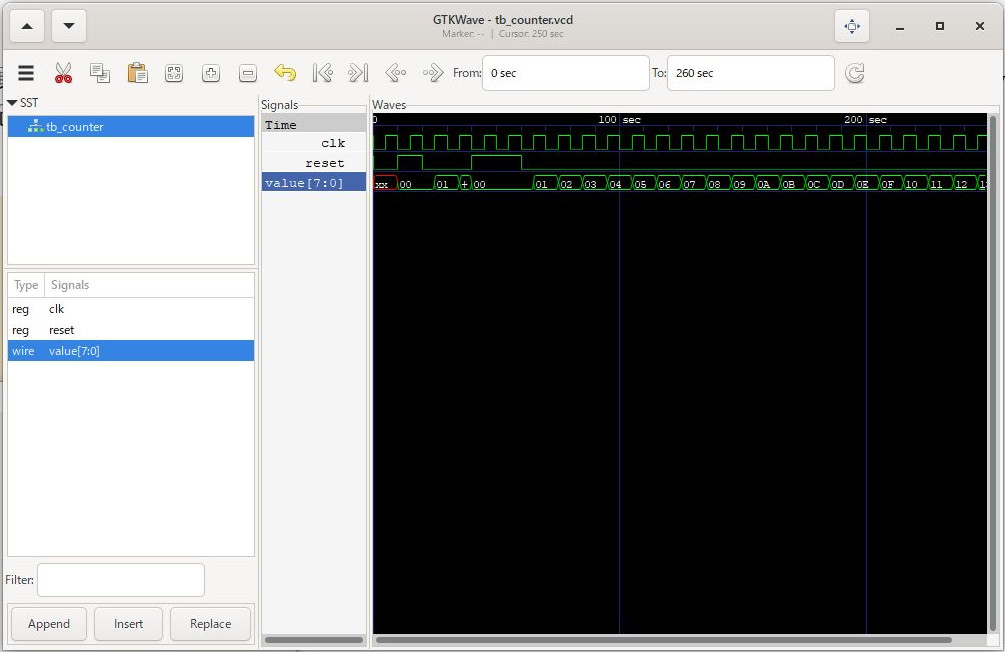
Then, we can display signals by double clicking the signal names shown in the lower left pane. I added clk, reset, value[7:0].
次に、右側のWaves に表示したい順番で、左下のペインにある信号をダブルクリックして行きます。
私は、clk, reset, value[7:0] の順番で追加しました。
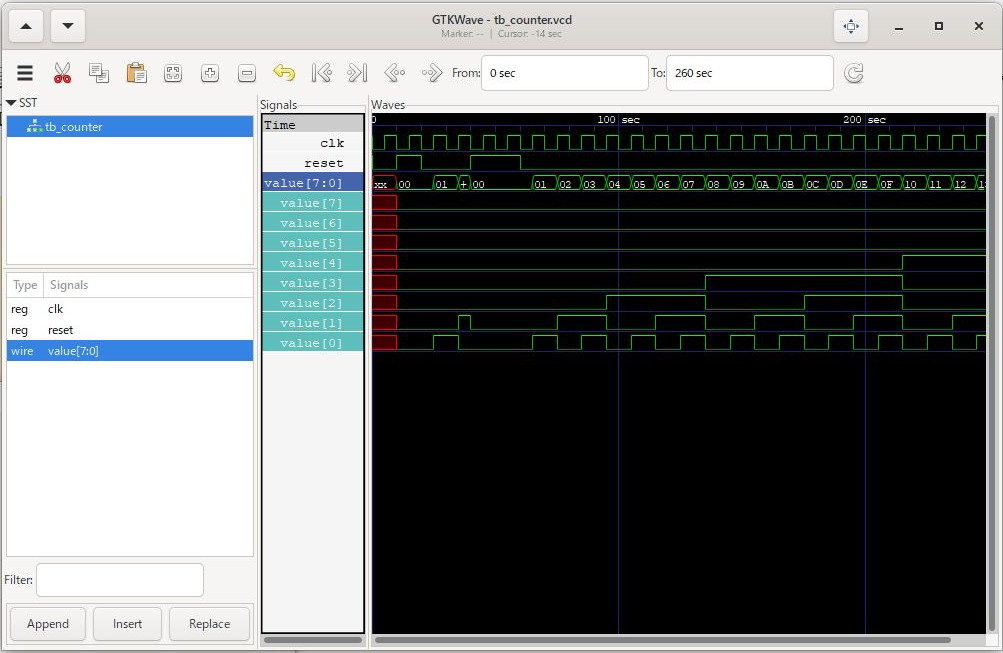
By double clicking the value[7:0] string in the Signals pain, we can observe each bits.
Signals ペインの value[7:0] をダブルクリックすると、各ビットを表示することができました。
So I hope that we can do the minimum Verilog HDL simulation with this.
これで最低限の Verilog HDL のシミュレーションは出来そうな感じになりました。
20-Nov-2021


コメント